Intro
In my last post I built a Project Tracker in a SharePoint/Microsoft List (Click here to see that post), today I’m discussing how to build reporting in Power BI that directly connects to the dataset in that SharePoint List. Power BI provides advanced reporting capabilities and connects with many types of data sources to include SharePoint Lists. Having advanced customizable reporting is advantageous for all levels of stakeholders involved in the project by keeping the team aligned and finishing milestones on-time.
I may interchange Microsoft Lists with SharePoint List and vice versa, to clarify Microsoft Lists is SharePoint Lists that is packaged as a separate application. If you create a Microsoft List, it will be created in SharePoint as a SharePoint List. For more information on Lists you can click here.
These are the topics to be discussed:
- Connect Power BI to a SharePoint List
- Change the Date Data Type Format
- Create Report Measures
- Create Report 1: Number of Items
- Create Report 2: Item List
- Create Report 3: Items by Status
- Create Report 4: Items Completed Trend Line
- Setup Cross Report Filtering
- Publish and Share the Reports
Connect Power BI to a SharePoint List
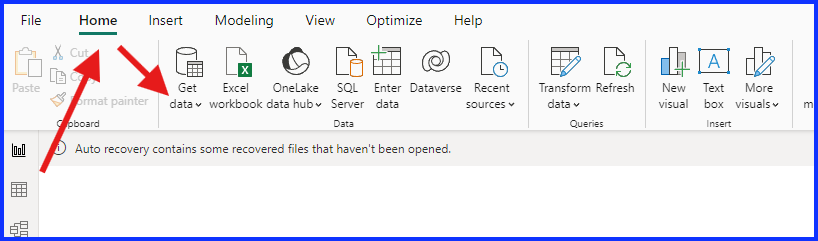
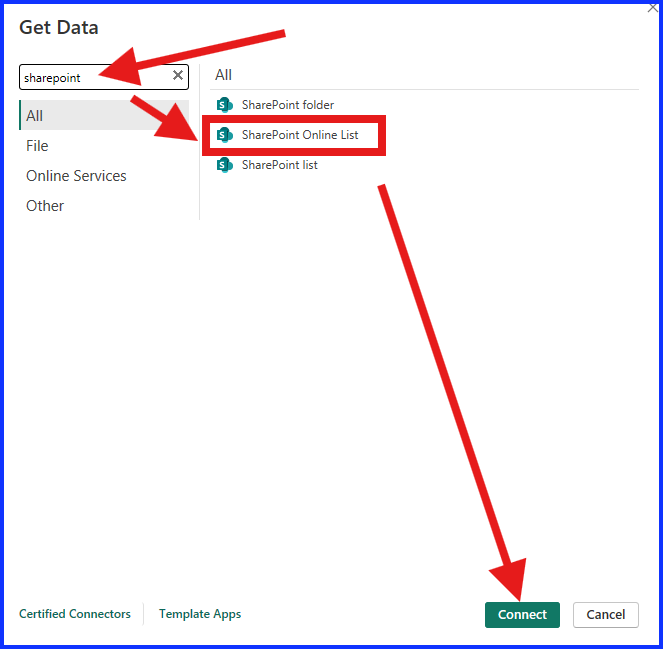
Open Power BI Desktop and create a new file, then under the “Home” menu, select “Get Data”, then “More”, type in “SharePoint” and select “SharePoint Online List” then click on “Connect”.
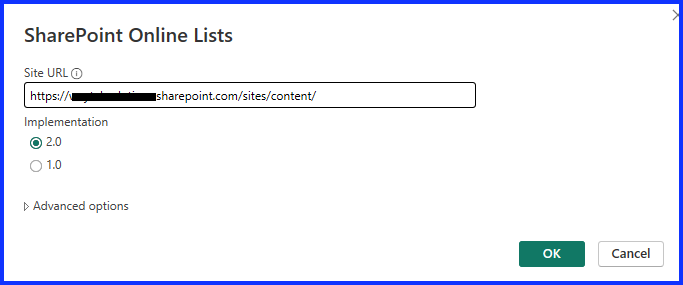
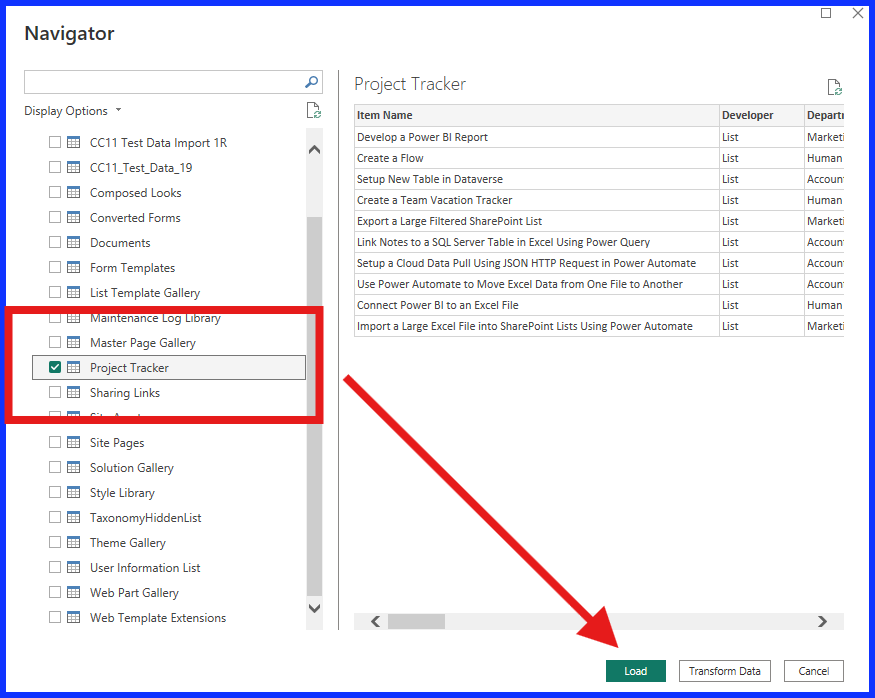
Enter the SharePoint Site URL (Go to the List in your web browser and copy its web link up to and before /Lists), under “Implementation” select “2.0”, then select “OK”. You will need to sign in with your Microsoft 365 account that you access the SharePoint List with. Look for your SharePoint List, select it, and then select “Load”. This will import the list data and meta data into Power BI.
Name and save the file as it does not automatically save.
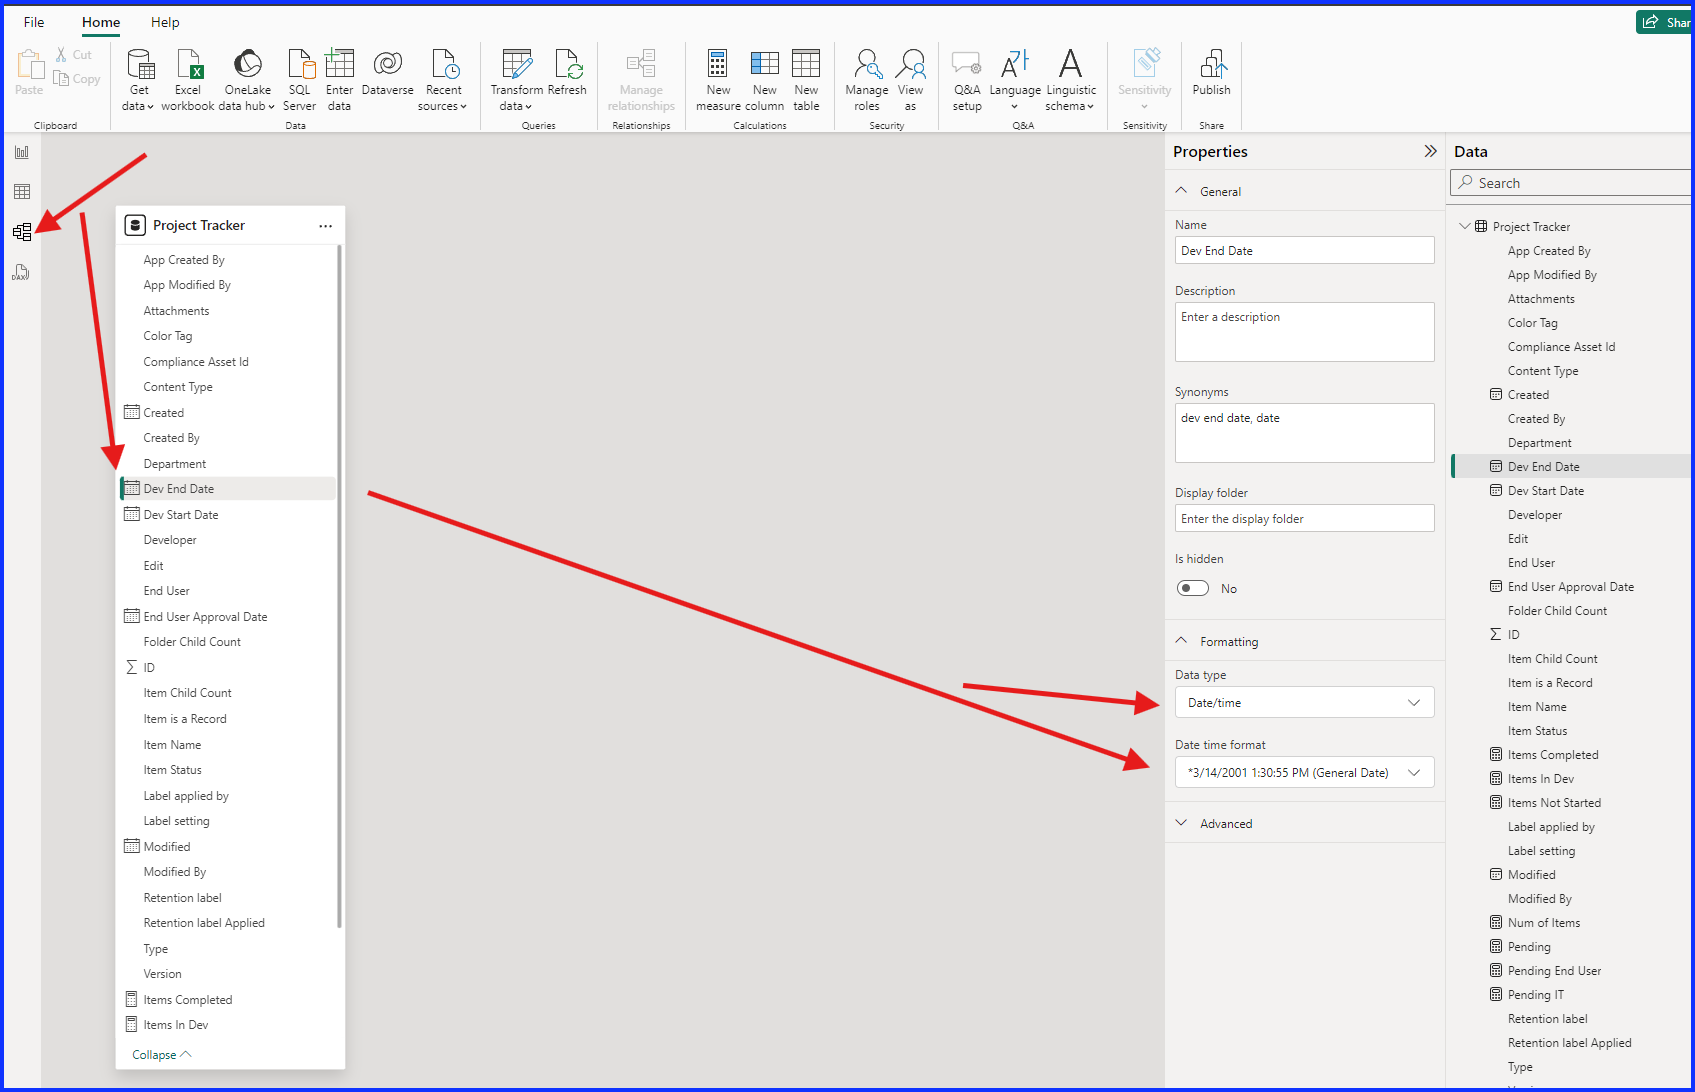
Change the Date Data Type Format
Go to “Model View”, select the “Dev End Date” column in the project tracker table, under “Properties, then change the “Data Type” from “Date/Time” to “Date”. Select the date format under “Date Time Format” of 03/14/2001 (mm/dd/yyyy).
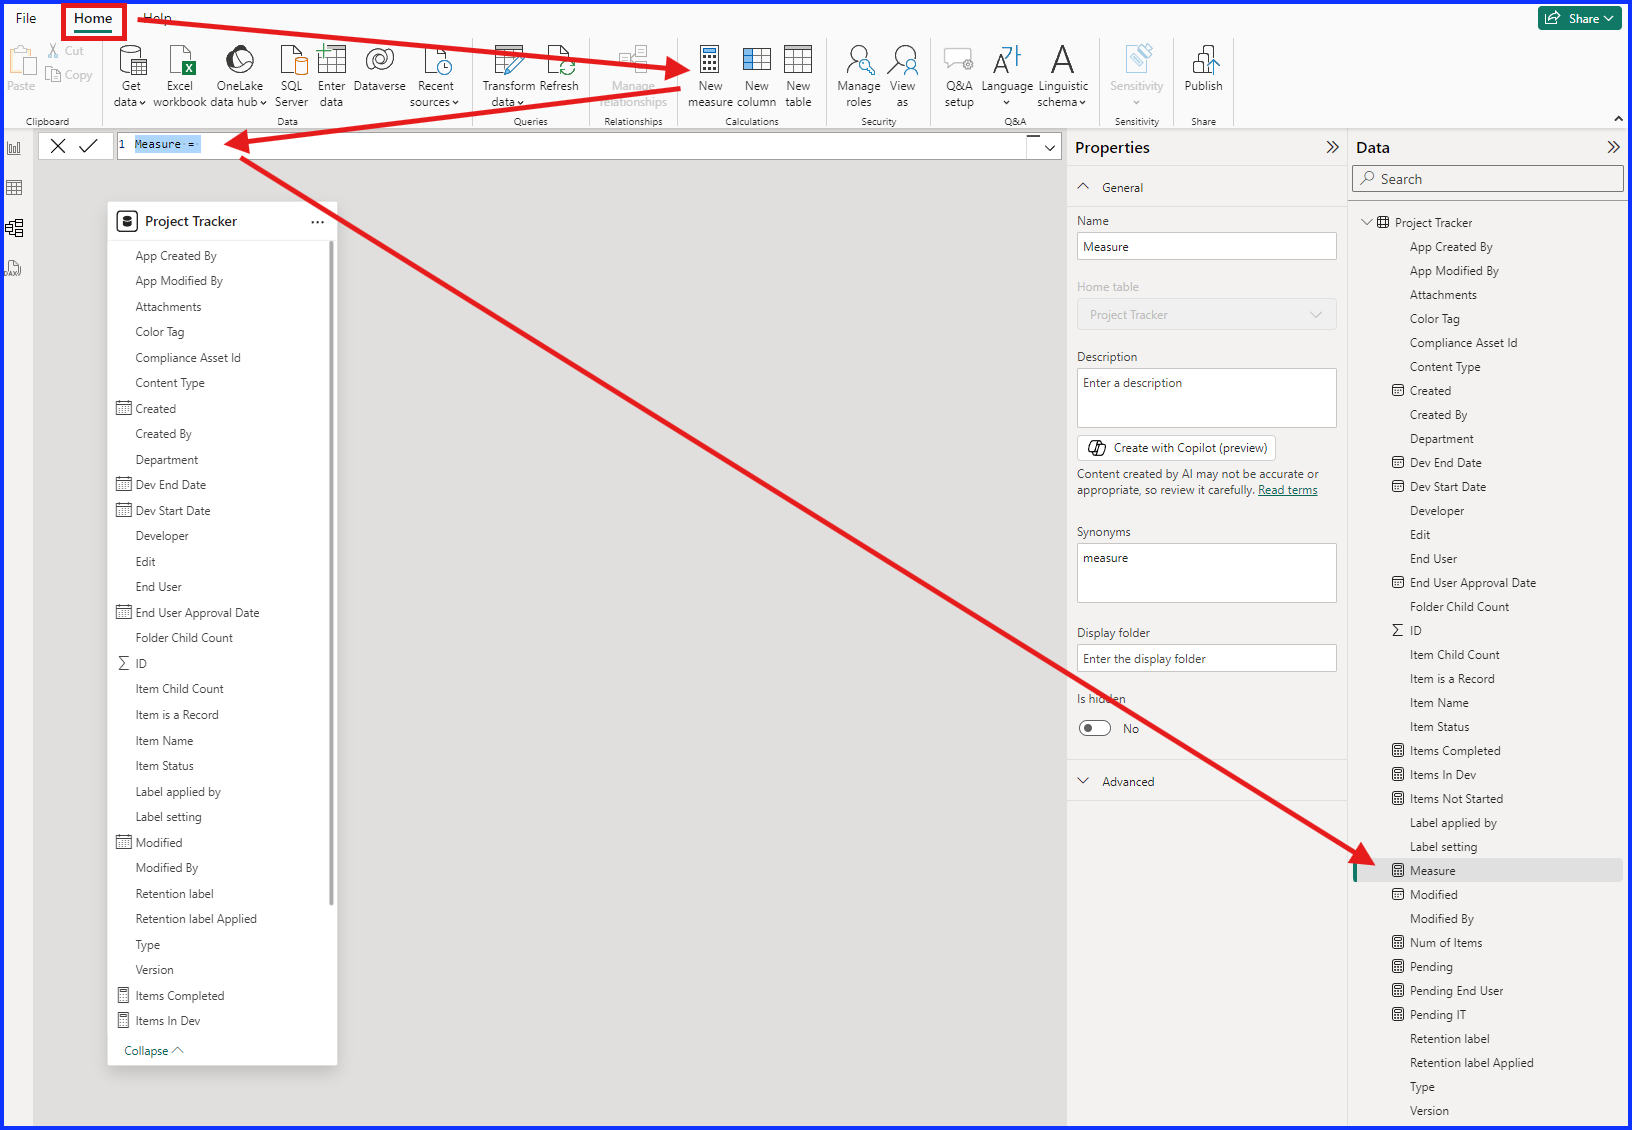
Create Report Measures
Before creating our reports, we need to create seven measures, measures are very useful in creating reports as they help summarize your data without having to create calculated columns. Click here for more information on measures.
The first step is to go to “Model View”, then go to the top “Home” menu and click on “New Measure”. From the “Home” menu, under the Calculations section, select “New Measure”. This will open up a formula bar, the formula language used is called Data Analysis Expression or DAX. The word before the equal sign is the name of the measure, which you can also see under the table columns on the left-hand side of the screen. You need to repeat this step for each measure created, below are the DAX formulas for each measure.
Items Completed = CALCULATE(COUNTROWS(‘Project Tracker’),FILTER(‘Project Tracker’,’Project Tracker'[Item Status]= “End User Approval”))
Items In Dev = CALCULATE(COUNTROWS(‘Project Tracker’),FILTER(‘Project Tracker’,’Project Tracker'[Item Status]= “In Development”))
Items Not Started = CALCULATE(COUNTROWS(‘Project Tracker’),FILTER(‘Project Tracker’,’Project Tracker'[Item Status]= “Not Started”))
Num of Items = COUNT(‘Project Tracker'[Item Name])
Pending = CALCULATE(COUNTROWS(‘Project Tracker’),FILTER(‘Project Tracker’,’Project Tracker'[Item Status]= “In Development” || ‘Project Tracker'[Item Status]= “QA Testing” || ‘Project Tracker'[Item Status]= “End User Testing”))
Pending End User = CALCULATE(COUNTROWS(‘Project Tracker’),FILTER(‘Project Tracker’,’Project Tracker'[Item Status]= “End User Testing”))
Pending IT = CALCULATE(COUNTROWS(‘Project Tracker’),FILTER(‘Project Tracker’,’Project Tracker'[Item Status]= “In Development” || ‘Project Tracker'[Item Status]= “QA Testing”))
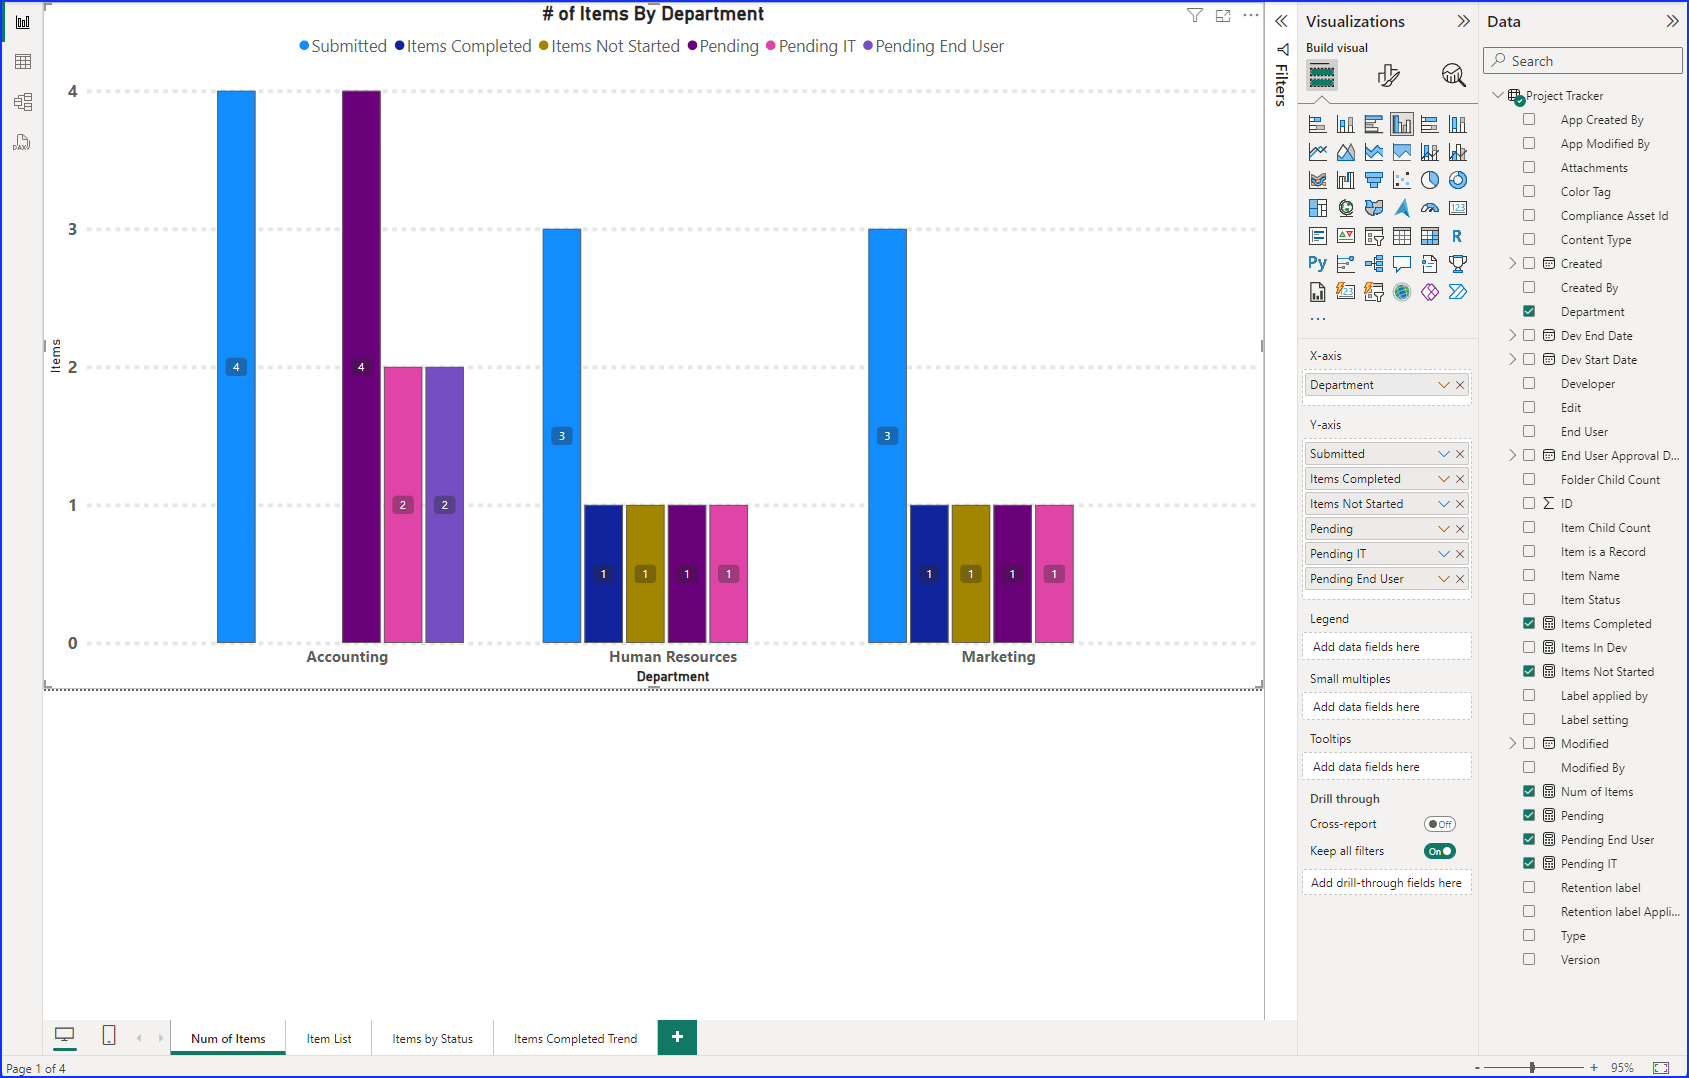
Report 1: Number of Items
To build report 1, select the “Clustered Bar Chart” visualization and drag “Department” under the X-Axis field. Under the Y-Axis field, add the following columns: Submitted, Items Completed, Items Not Started, Pending, Pending IT, and Pending End User. To see how I formatted this report visit my YouTube video and go to 9 minutes 20 seconds mark.
Report 2: Item List
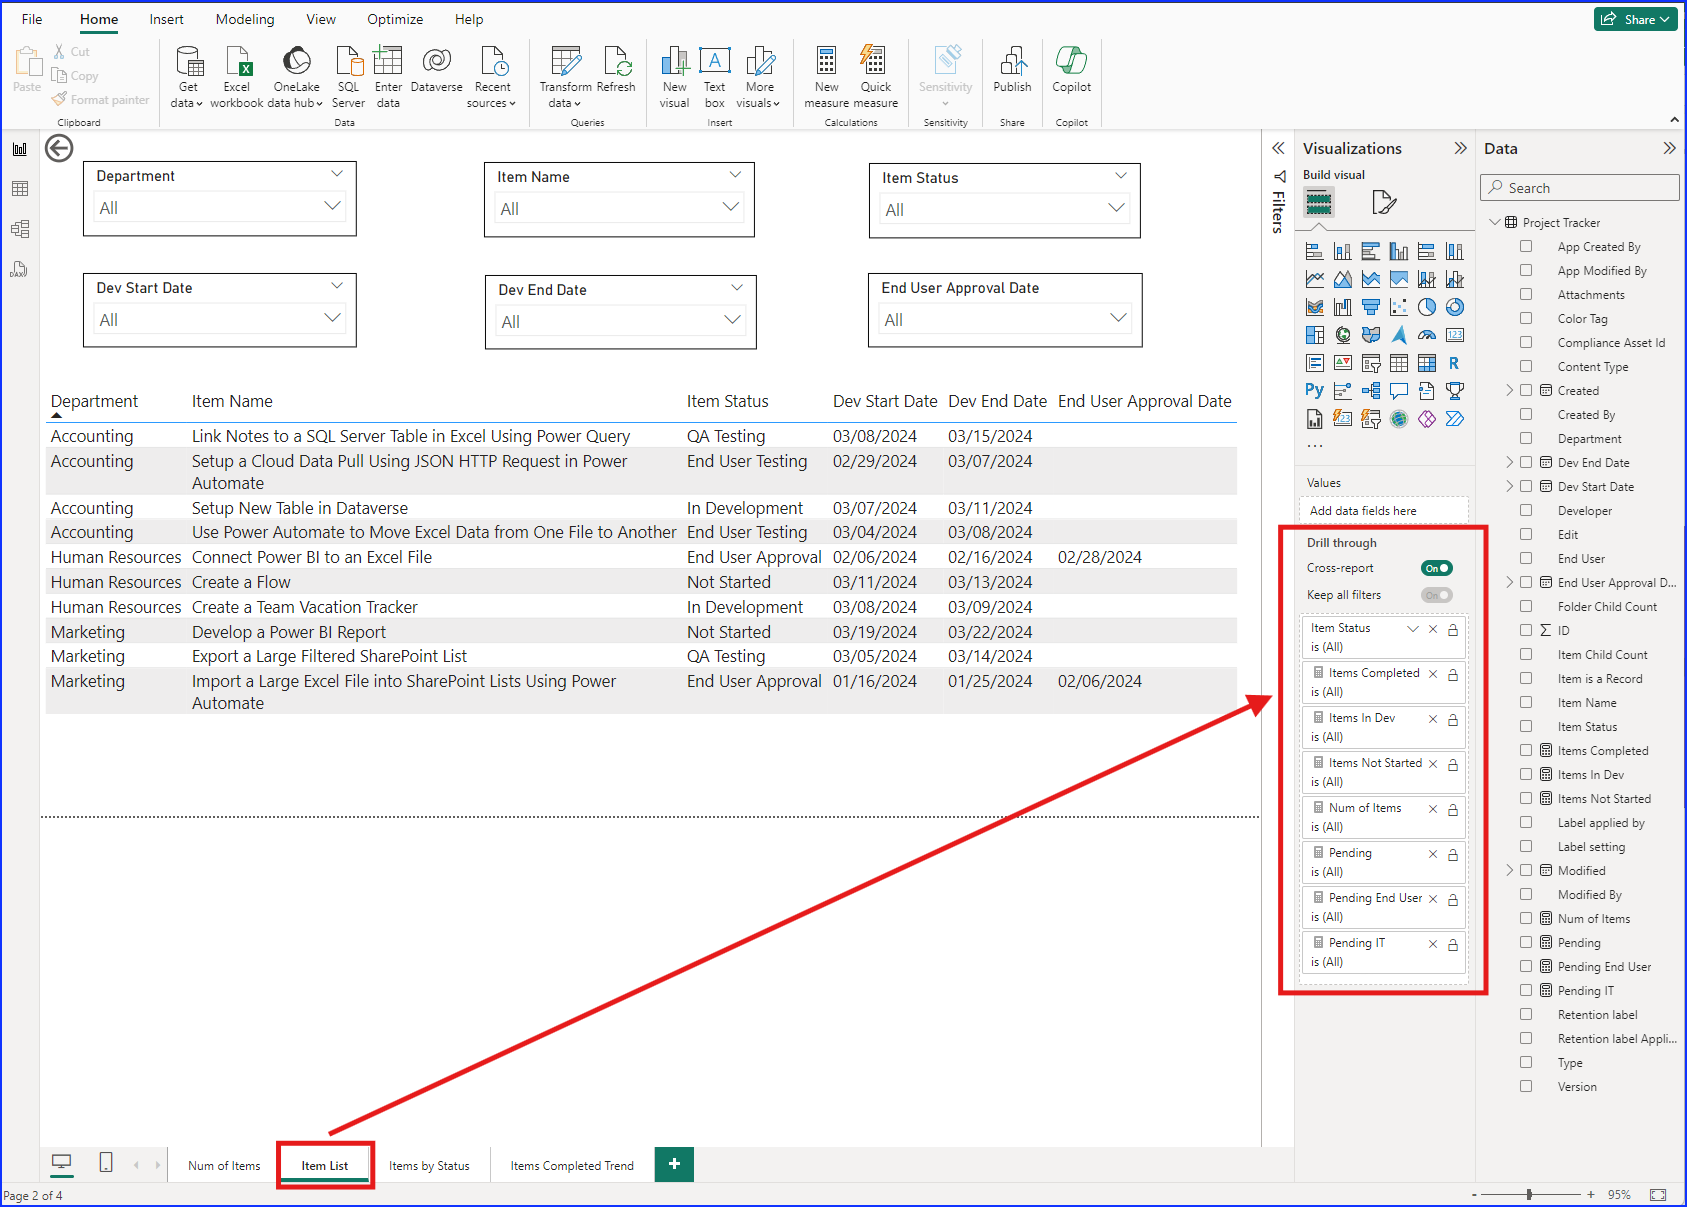
The second report has six “Slicer” visualizations and one “Table” visualization. Each slicer is a drop down and has a single column which include Department, Item Name, Item Status, Dev Start Date, Dev End Date, and End User Approval Date. Put the “Table” visual under the slicers and add the same columns as the slicers and in the of: Department, Item Name, Item Status, Dev Start Date, Dev End Date, and End User Approval Date. To see how I formatted this report visit my YouTube video and go to 14 minutes 15 seconds mark.

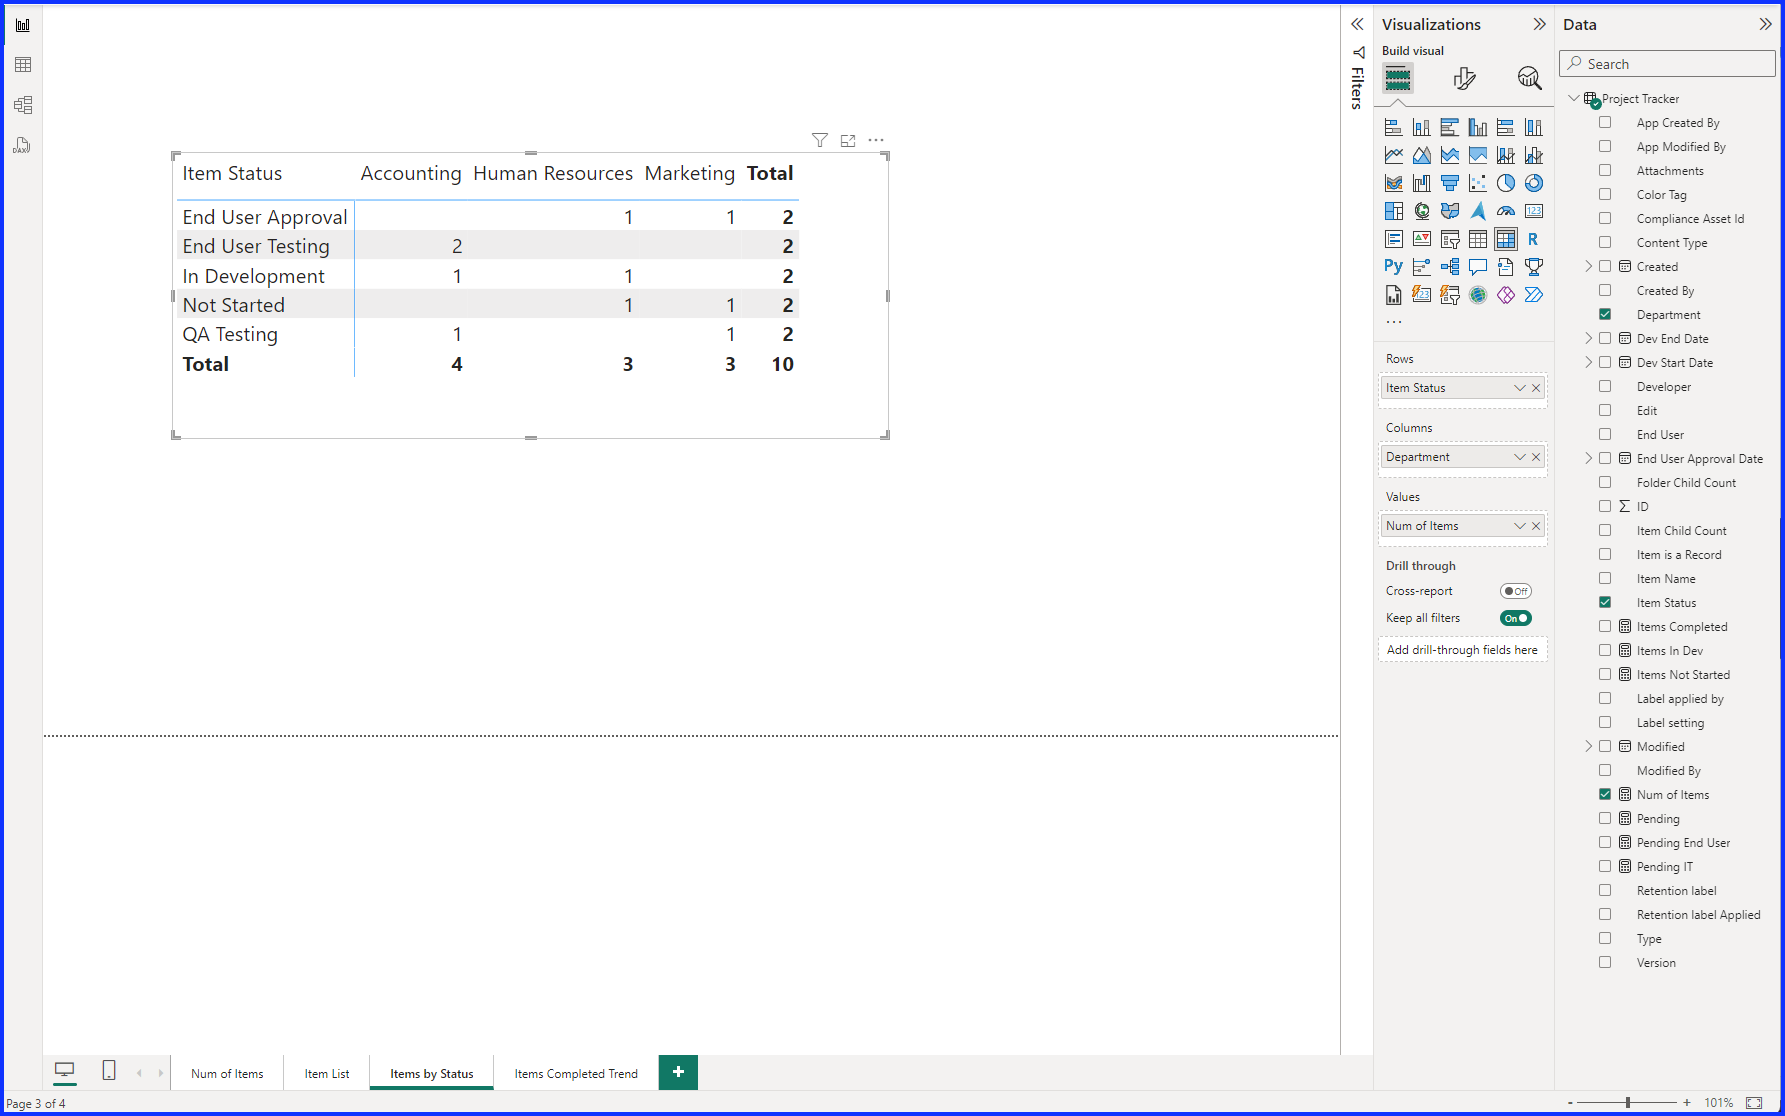
Report 3: Item by Status
For this report select the “Matrix” visualization, add “Item Status” to the “Rows” field, “Department” to the “Columns” field, and “Num of Items” to the “Values” field. To see how I formatted this report visit my YouTube video and go to 21 minutes and 00 seconds mark.
Report 4: Items Completed Trend Line
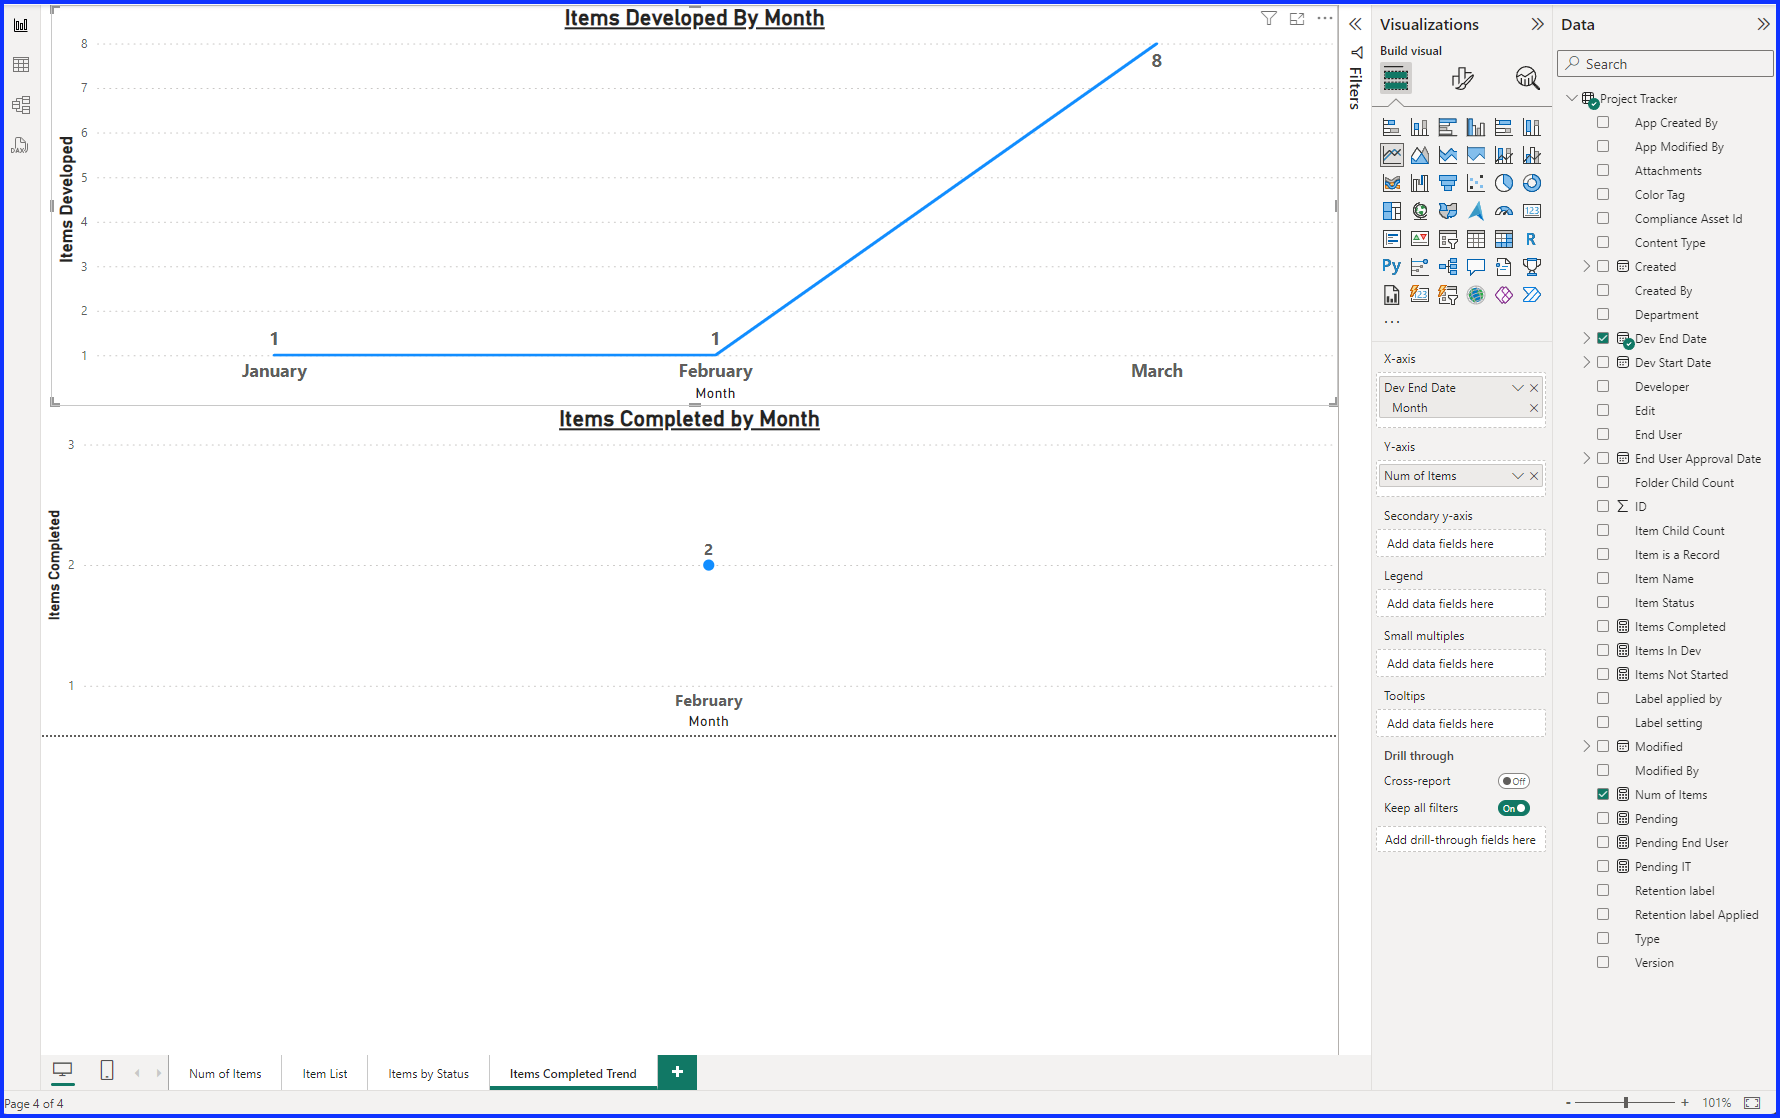
The fourth and last report is made up of two separate Line Charts, one stacked on top of the other. The top graph tracks the items developed by month. Its X-axis column is “Dev End Date” and is in the format of a Date Hierarchy and only has the month filter. The Y-axis is the “Num of Items” column.
The bottom graph tracks the items completed by month. Its X-axis column is “User End Approval Date” and is in the format of a Date Hierarchy and only has the month filter. The Y-axis is the “Items Completed” column. To see how I formatted this report visit my YouTube video and go to the 22 minutes and 10 seconds mark.
Cross Report Filters
Cross report filters allow you to drill down on data from one report to another. We are going to use the item details in the “Item List” report to drill down from our other reports. Go to the “Item List” report, under the Visualization pane go to “Drill Through” and change the “Cross-Report” toggle to “On”. Drag the columns below to the field that says, “Add Drill Through Fields Here”. These are all the fields available to filter by in your report.
- Item Status
- Items Completed
- Items In Dev
- Items Not Started
- Num of Items
- Pending
- Pending End User
- Pending IT
You will notice a “Back Button” is added to the report in the upper left of the screen. This is used when cross report filtering to quickly go back to report you came from.
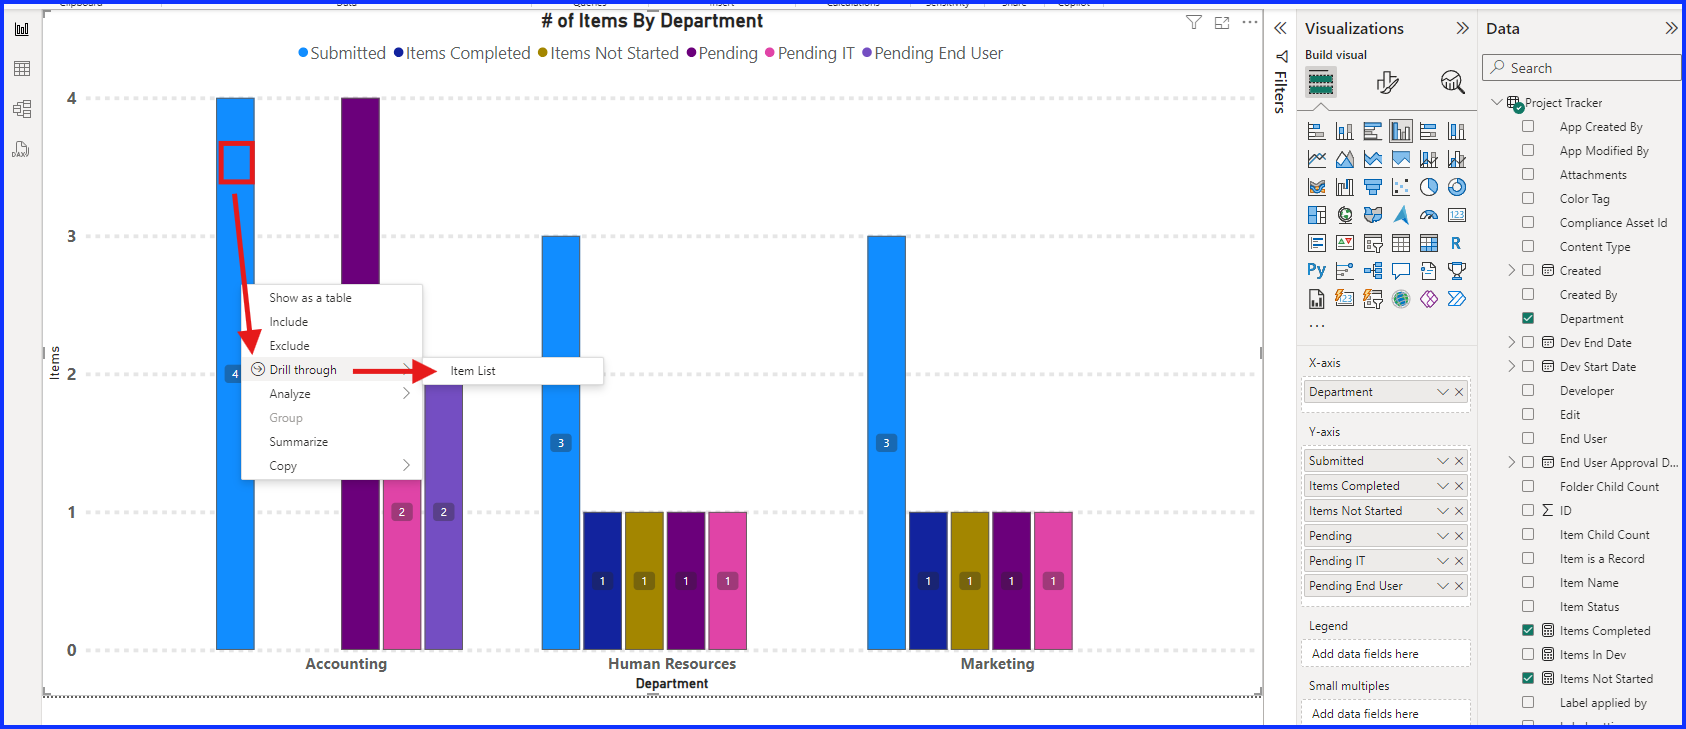
To initiate the cross filter, go to another report and right click on a value. On the menu, go to “Drill Through” and then select “Item List”.
Publish and Share
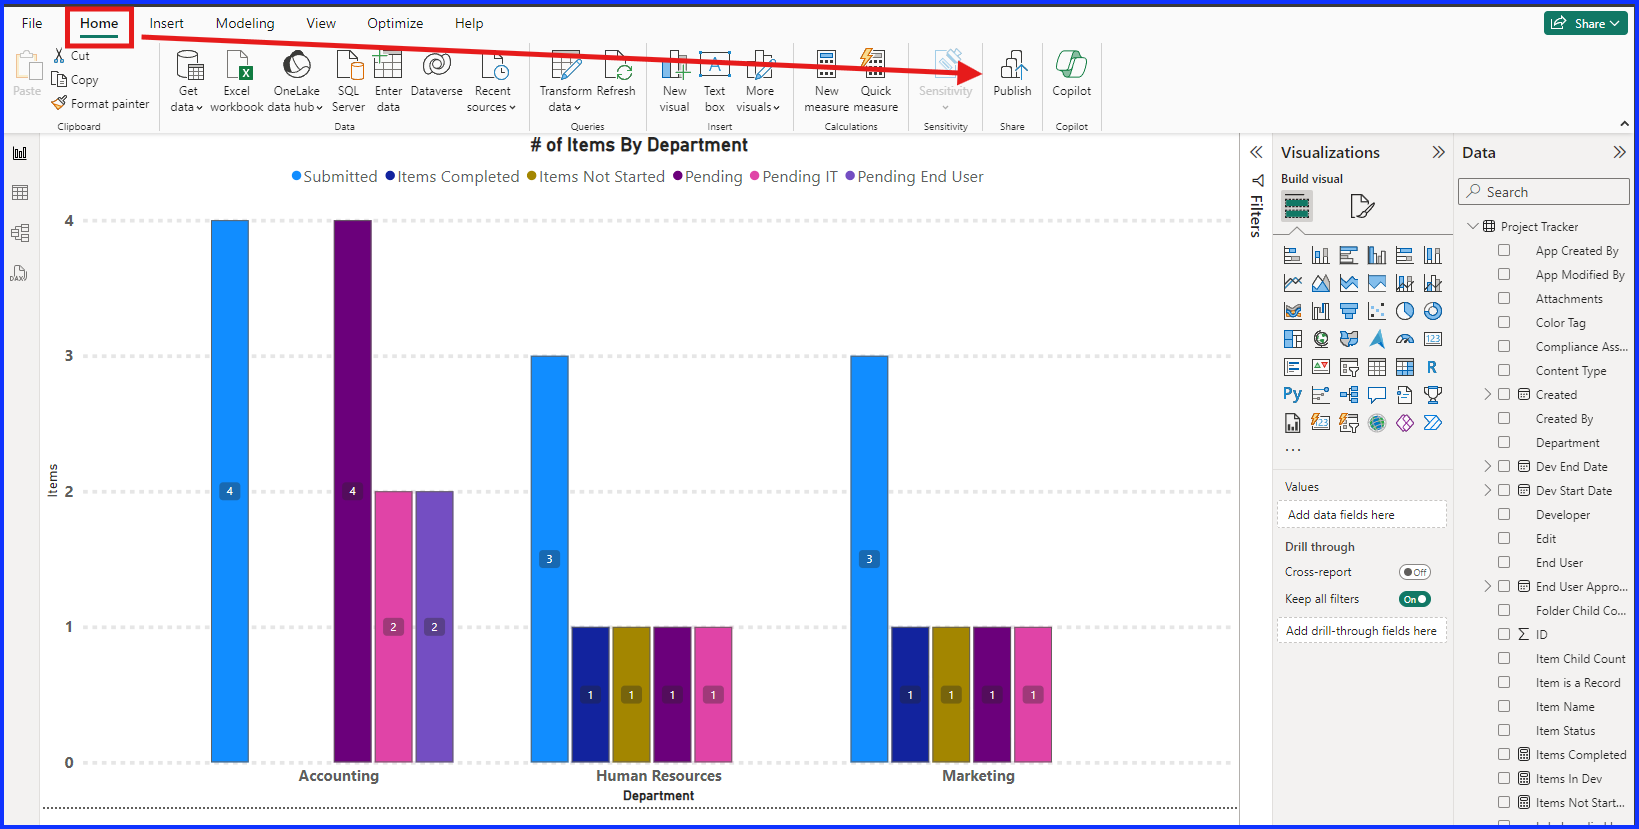
Now you are ready to publish the reports to the Power BI cloud service, this will allow you to share the reports with others. To do this, go to the “Report View”, under the “Home” menu, select “Publish”. You’ll be prompted to save your file and then select your publish destination. You can publish to “My Workspace” or depending on your licensing, to other workspaces.
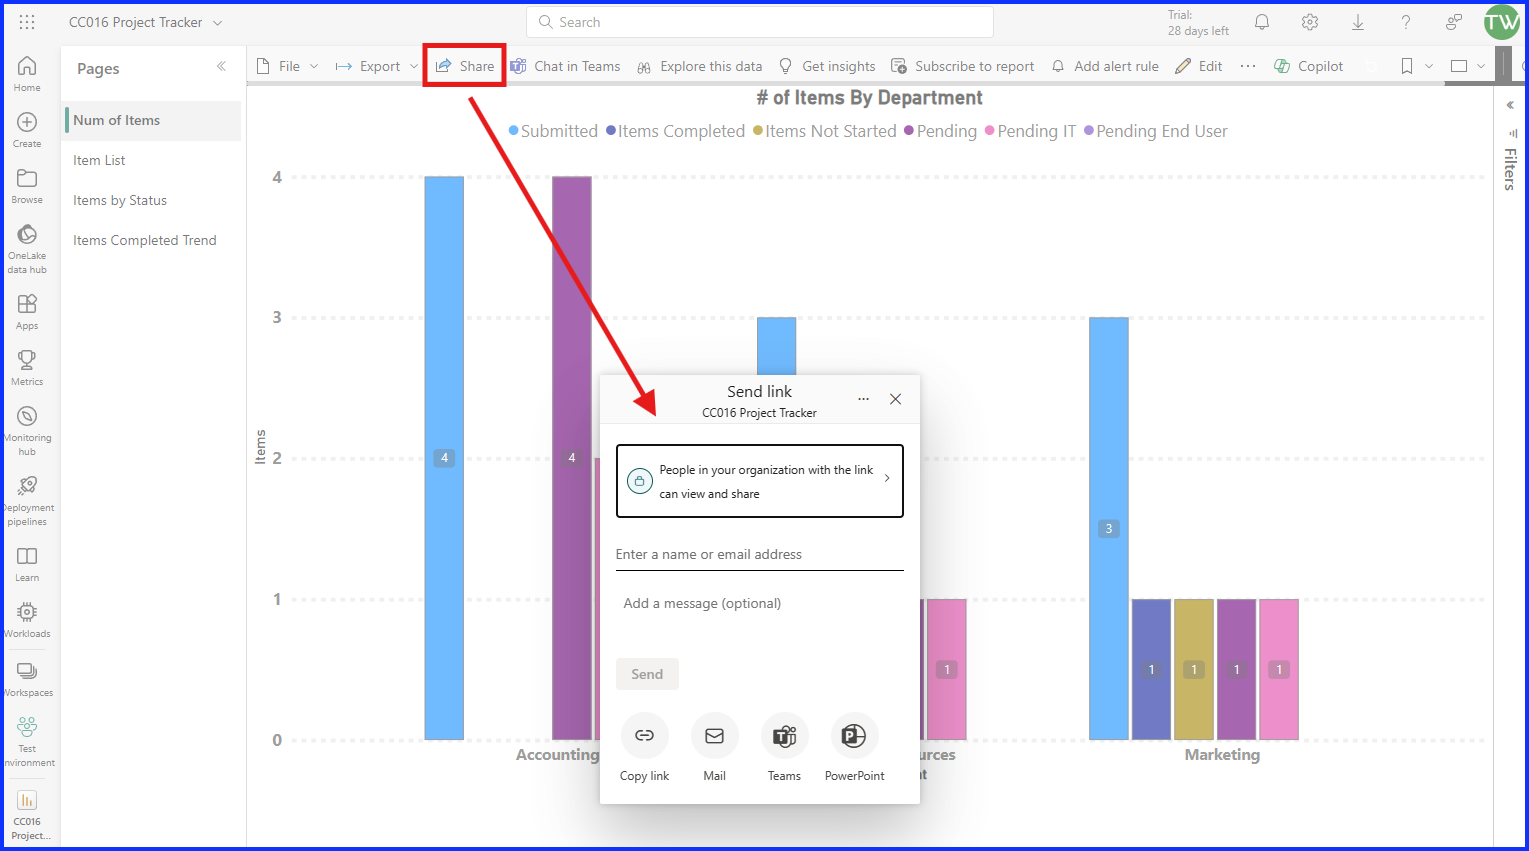
To share your reports, from the Power BI service, go to the top menu, select “Share”, this will popup a share window where you can email, copy the link or add to Teams or PowerPoint. While in the sharing window you have the option to select user permissions and access.
Now your Power BI is ready to track your project status for all your stakeholders. To make sure your data stays refreshed on a regular basis, make sure to visit my next post on how to automatically sync your data. You can visit it by clicking here!