In this post we are going to take a look at the Power BI Date Table, how to set it up when the calendar year and fiscal year are different and show an example for each against the same set of summarized data.
A Power BI Date Table is a table that only contains date-related data and is probably the most consistent feature you will add to any of your models. It is a standard dimension table that can be used to reference dates across all tables within your data model. When setup properly, report authors can work with time intelligence visuals when filtering, grouping, and drilling down through calendar time periods.
Create a Date Table
There are many ways to create a date table in Power BI, for this post, I’ll be documenting the process for both the DAX CALENDAR and DAX CALENDARAUTO function. The CALENDAR function creates dates based on the time frame you provide and CALENDARAUTO scans your existing tables and creates the date range based on the earliest and oldest date in your tables.
Both functions can take into account a Fiscal Year that is different from the Calendar Year.
For more ways to create a date table, visit this link to Microsoft Learn: Create date tables in Power BI Desktop – Power BI | Microsoft Learn
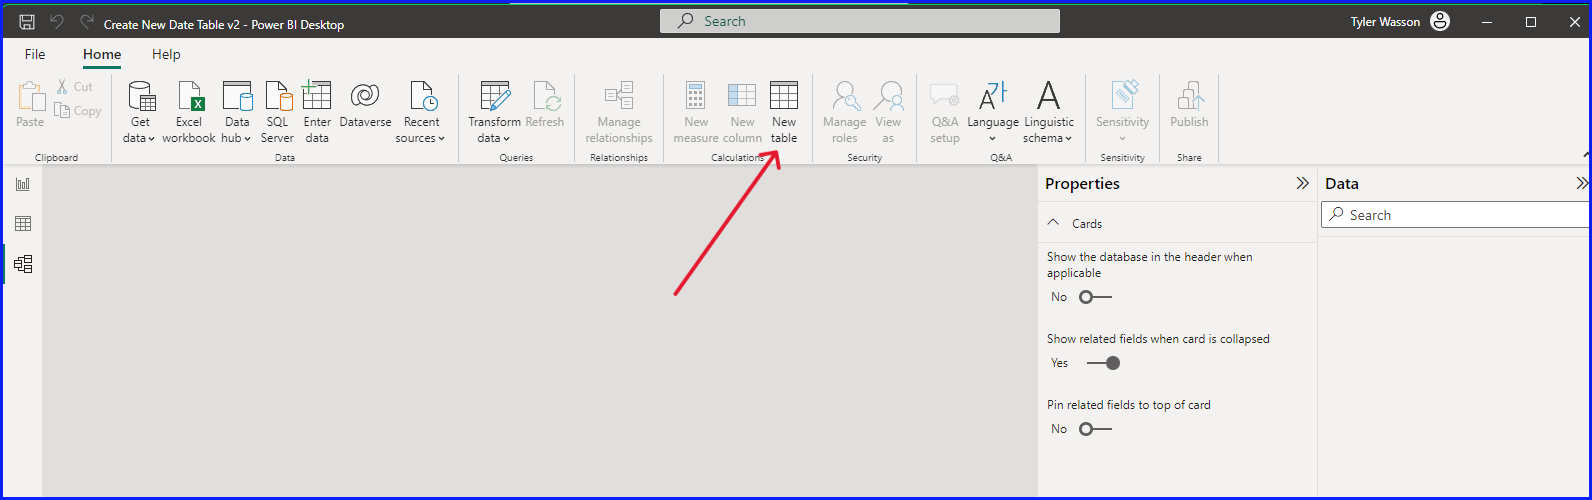
To create a Date Table open the Power BI Desktop, go to the model view, and from the Home ribbon select New Table.
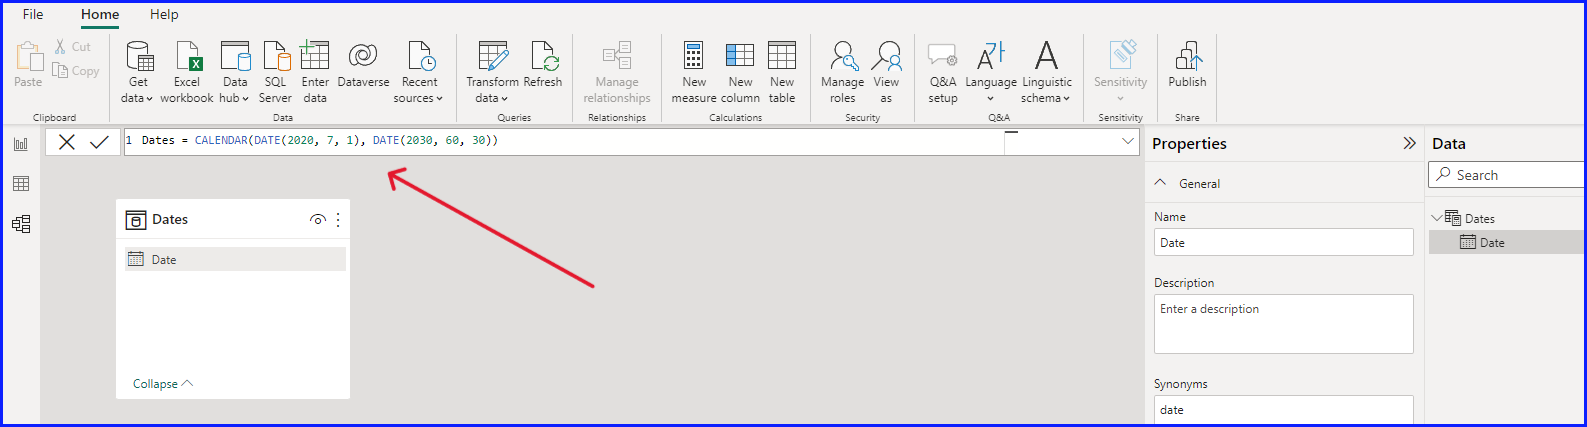
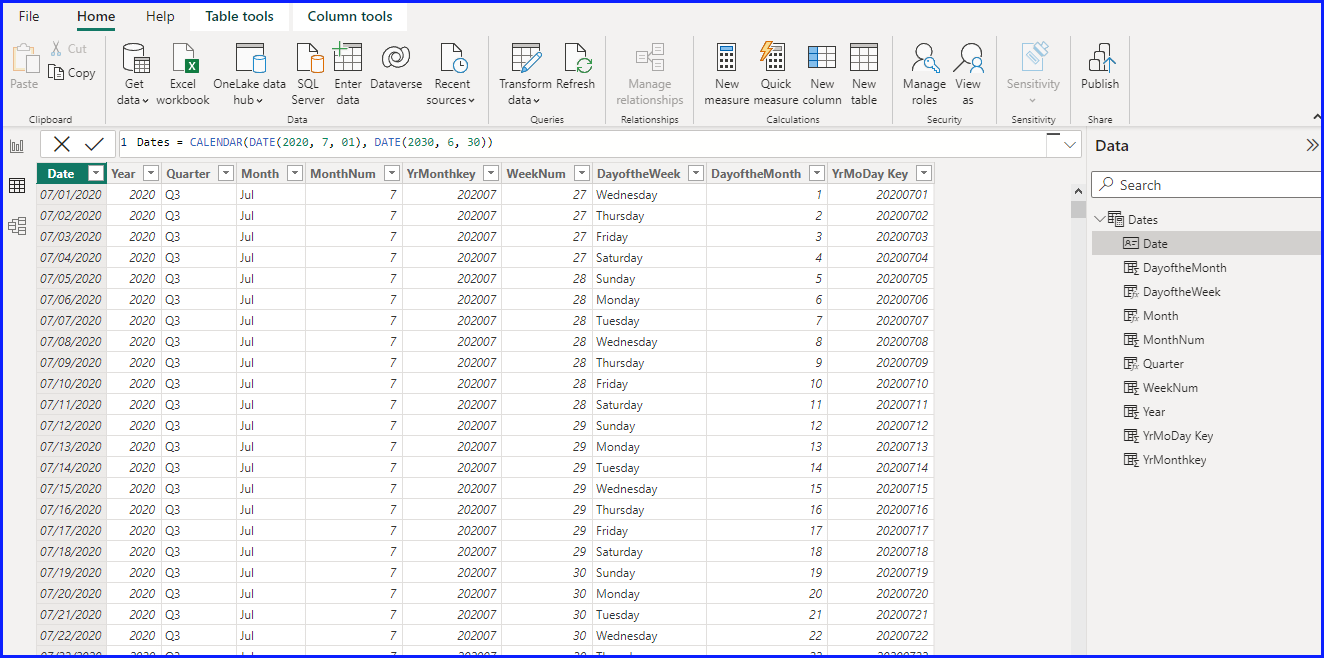
For this post, my Fiscal Year starts on 7/1 and is the starting month in the formula. You can substitute any starting month and date range to align to your Date Table. Enter the DAX formula below.
Dates = CALENDAR(DATE(2020, 7, 1), DATE(2030, 6, 30))
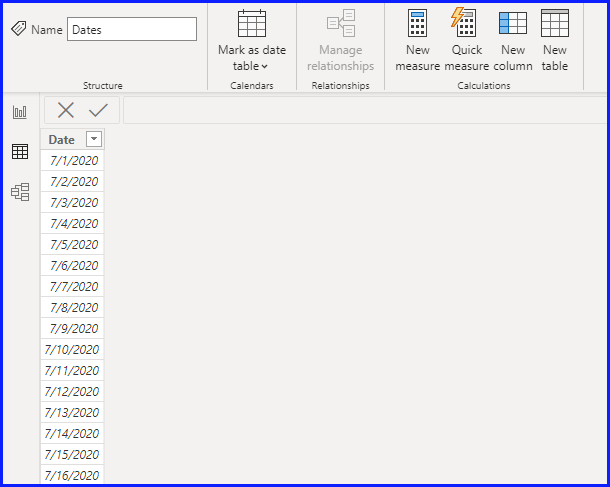
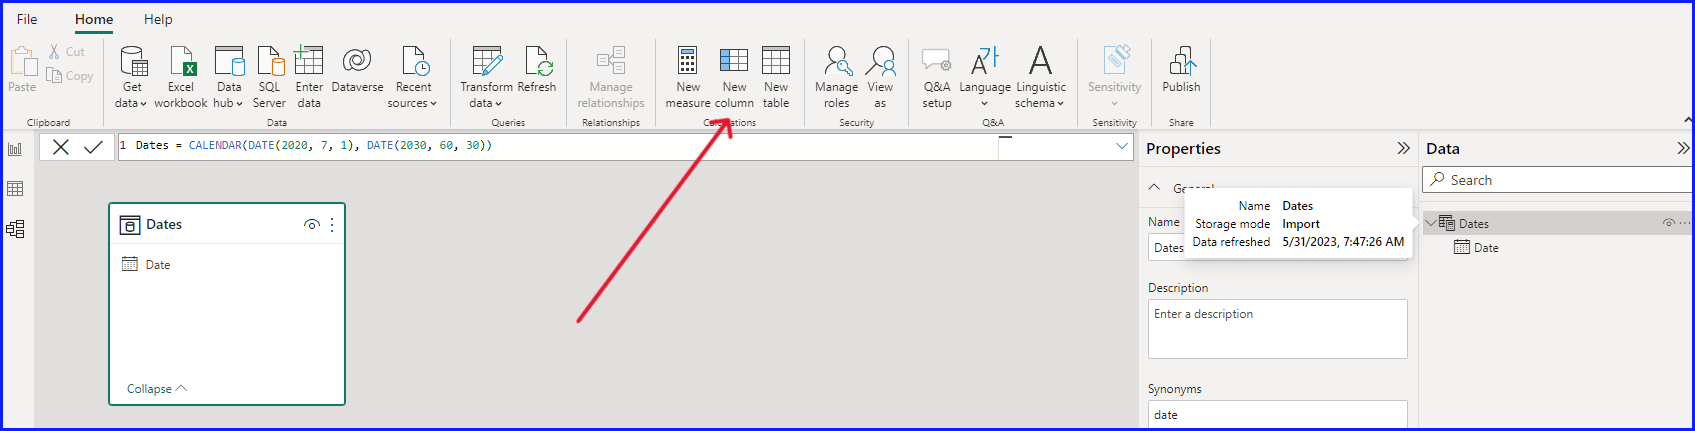
Then change Date Type to Date and Date Time Format to Short Date. Switch to Data View, your Date column should have 5,296 rows and look the same as below.
To use the CALENDARAUTO function enter the formula below. I’ve entered 6 within the brackets, which states the last month in the Fiscal Year is June to start the dates running from July 1st. If the Fiscal and Calendar Year are the same, leave it blank.
Dates = CALENDARAUTO(6)
Most of the formulas to be built in the Dates table are based on the primary date column Date: Dates[Date].
Add Calendar Year Columns
Using the DAX formulas in the table below, add the six calculated columns to the table, they are all based on the standard calendar year and listed below.
| Calendar Year Dates | DAX Formulas |
|---|---|
| Calendar Year | Year = YEAR(Dates[Date]) |
| Calendar Quarter | Quarter = “Q” & QUARTER(Dates[Date]) |
| Calendar Month | Month = FORMAT(Dates[Date],”MMM”) |
| Calendar Month Number | MonthNum = MONTH(Dates[Date]) |
| Calendar Year Month Key | YrMonthkey = (YEAR(‘Dates'[Date]) * 100) + MONTH(‘Dates'[Date]) |
| Calendar Week Number | WeekNum = WEEKNUM(Dates[Date]) |
| Calendar Day of Week | DayoftheWeek = FORMAT(Dates[Date], “DDDD”) |
| Calendar Day of Month | DayoftheMonth = DAY(Dates[Date]) |
| Calendar Day Number | YrMoDaykey = FORMAT(Dates[Date], “yyyyMMdd”) * 1 |
Make sure to remove the summarization for the number columns where necessary. The Date table should look like the table below:
Add Fiscal Year Columns
Next, we are going to add the Fiscal Year columns based on the fiscal year starting on July 1st. I currently work at Microsoft and July is the start of the fiscal year and much of the reporting I do switches between both calendar year and fiscal year depending on the ask. You can change the start of the Fiscal Year to any other month.
| Fiscal Year Dates | Dax Formulas |
|---|---|
| Fiscal Year | Fiscal Year = “FY” & (YEAR(Dates[Date]) + (MONTH(Dates[Date])>=7) |
| Fiscal Quarter | Fiscal Quarter = “FQ” & QUARTER(EDATE(Dates[Date], -6)) |
| Fiscal Year Quarter Combined | Fiscal YQ = “FY” & (YEAR(Dates[Date]) + (MONTH(Dates[Date])>=7) & “-Q” & QUARTER(EDATE(Dates[Date], -6)) |
| Fiscal Month Number | Fiscal MonthNum = MONTH(EDATE(Dates[Date], -6)) |
| Fiscal Month | Fiscal Month = FORMAT(Dates[Date], “yyyy”) & “-” & FORMAT(Dates[Date], “MMM”) |
| Fiscal Week Number | Fiscal WeekNum = VAR FiscalWeek = [WeekNum] – 27 +1 RETURN IF(FiscalWeek <= 0, 52 +FiscalWeek, FiscalWeek) |
| Fiscal Year Month Key | Fiscal YrMoKey = ((YEAR(Dates[Date]) + (MONTH(Dates[Date])>=7)) * 100) + Dates[Fiscal MonthNum] |
| Fiscal Year Month Day Key | Fiscal YrMoDayKey = ((YEAR(Dates[Date]) + (MONTH(Dates[Date])>=7)) * 10000) + (Dates[Fiscal MonthNum] * 100) + DAY(Dates[Date]) |
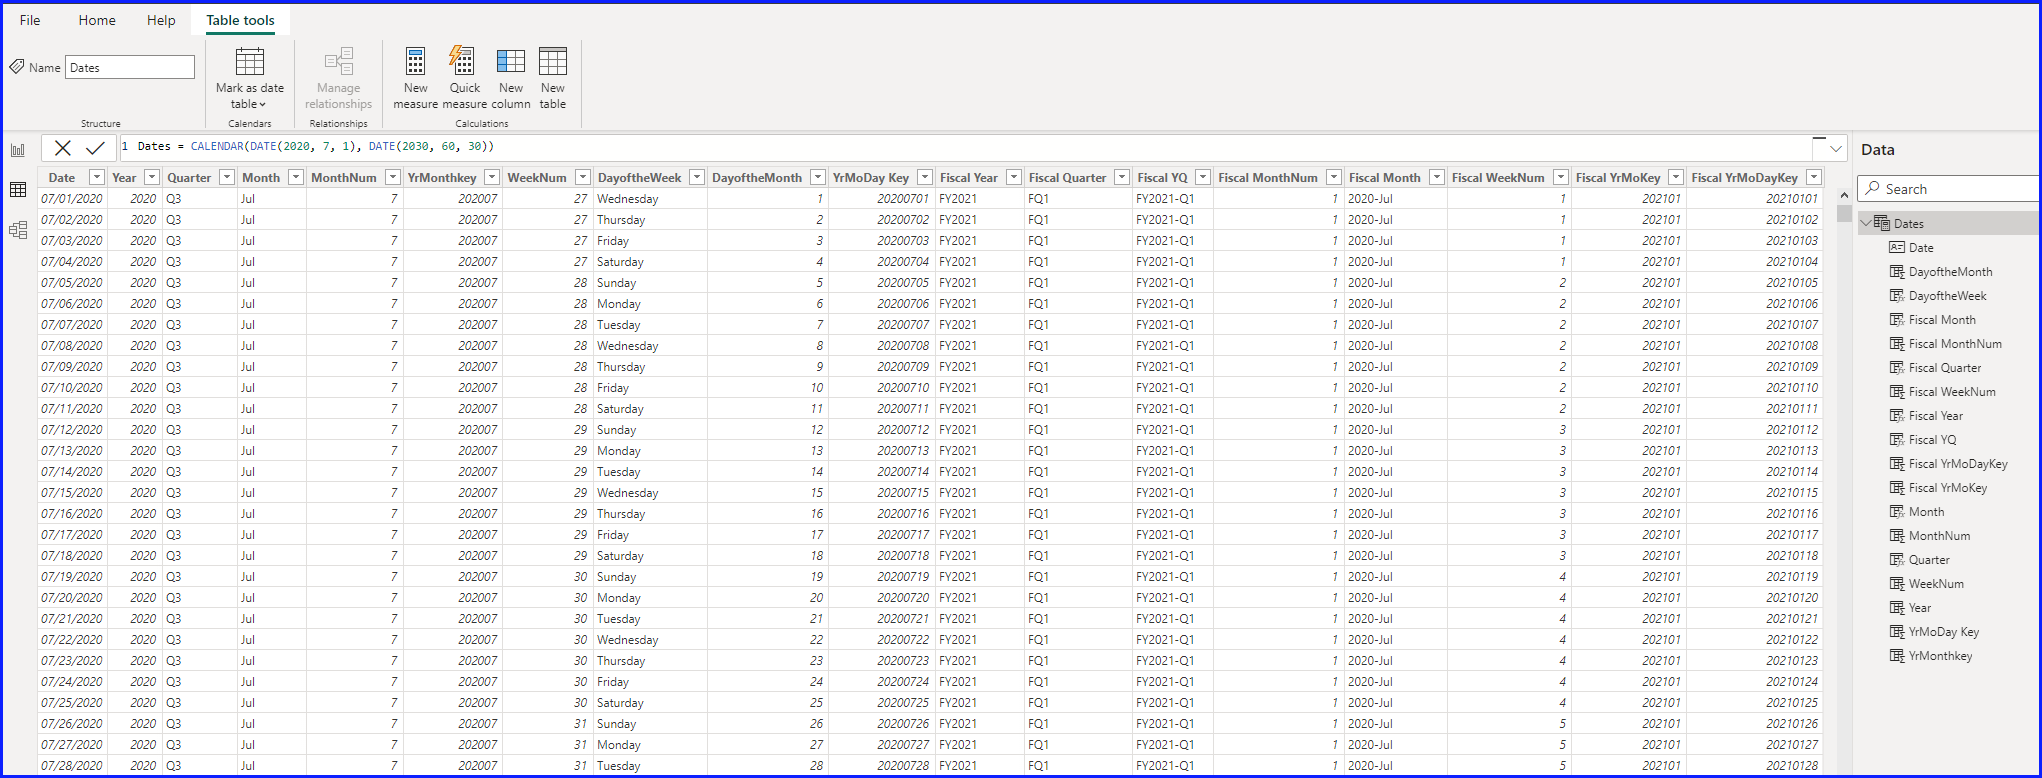
The Date Table should now look like the table below and are the columns I typically use in my day-to-day at Microsoft in either Power BI or Excel for reporting and sorting.
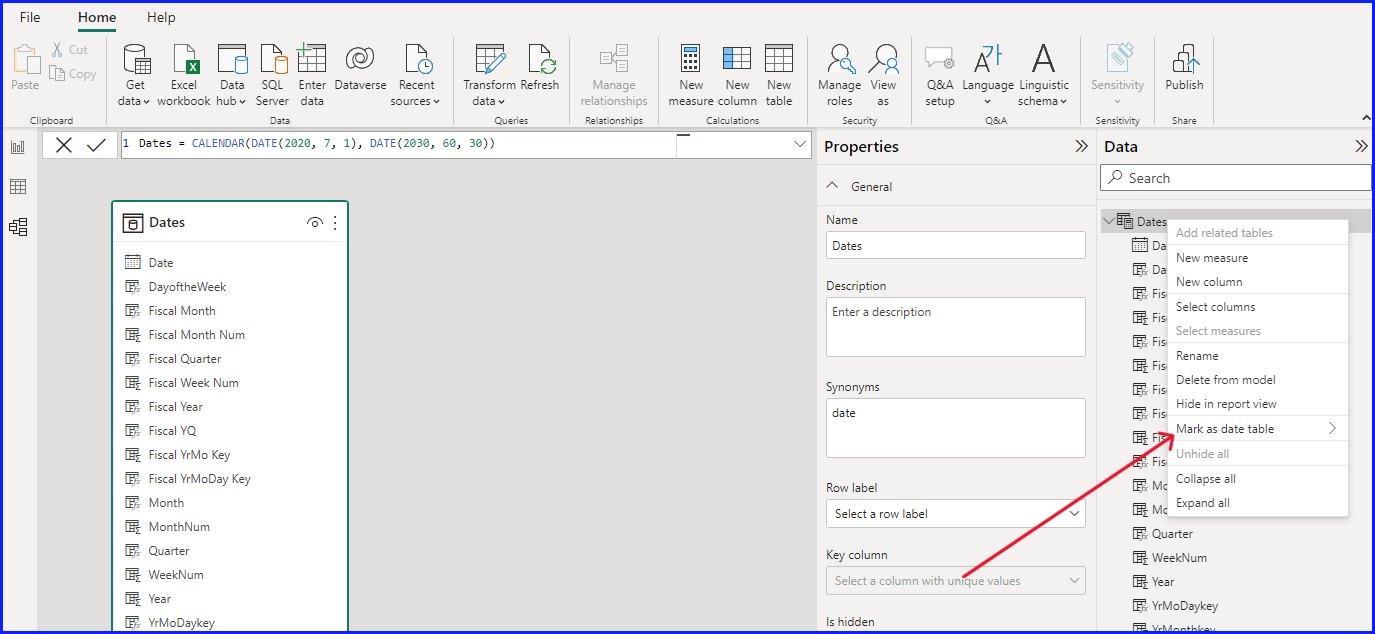
Mark As Date Table
The next step is to make your new date table as the primary date table by marking it as the Date Table. Right click on the Date Table in either the Data view or Model view and select Mark as the Date Table.
Next select Date for your Date column. It should be the first column in your table and only option in the drop-down list.
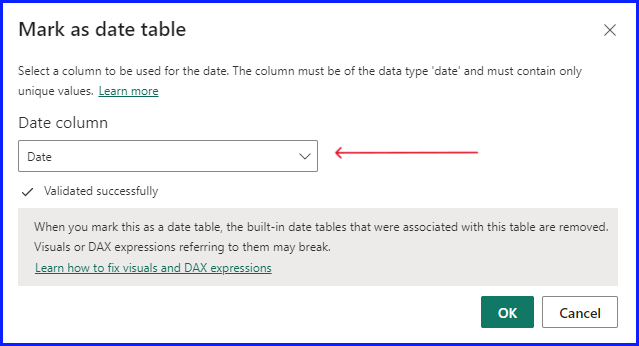
This removes the Auto Date/Time feature and Hierarchy’s for this table and any table it’s linked to. For more information on the Auto Date/Time feature, click on the link below.
Auto date/time in Power BI Desktop – Power BI | Microsoft Learn
Setup Date Hierarchy
Now let’s setup the Date Hierarchy for our Date Table. I create a few based on the Calendar and Fiscal year. Right click on the Date field and select “Create Hierarchy”.
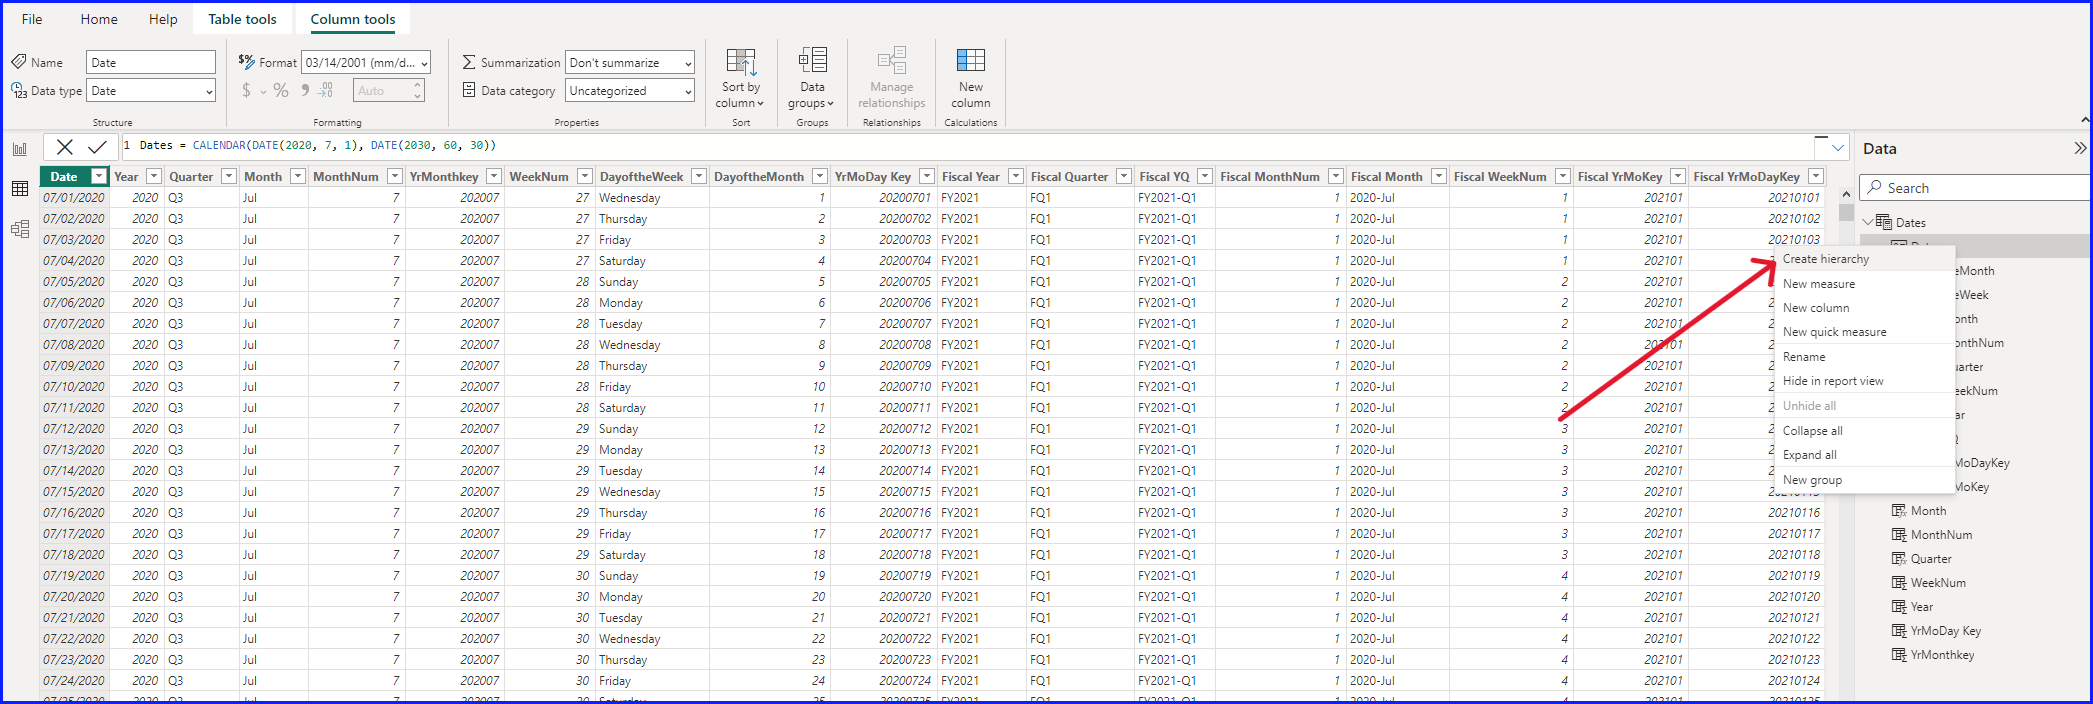
This will open up the properties pane near the bottom is the Hierarchy picker where you select the fields in the hierarchy.
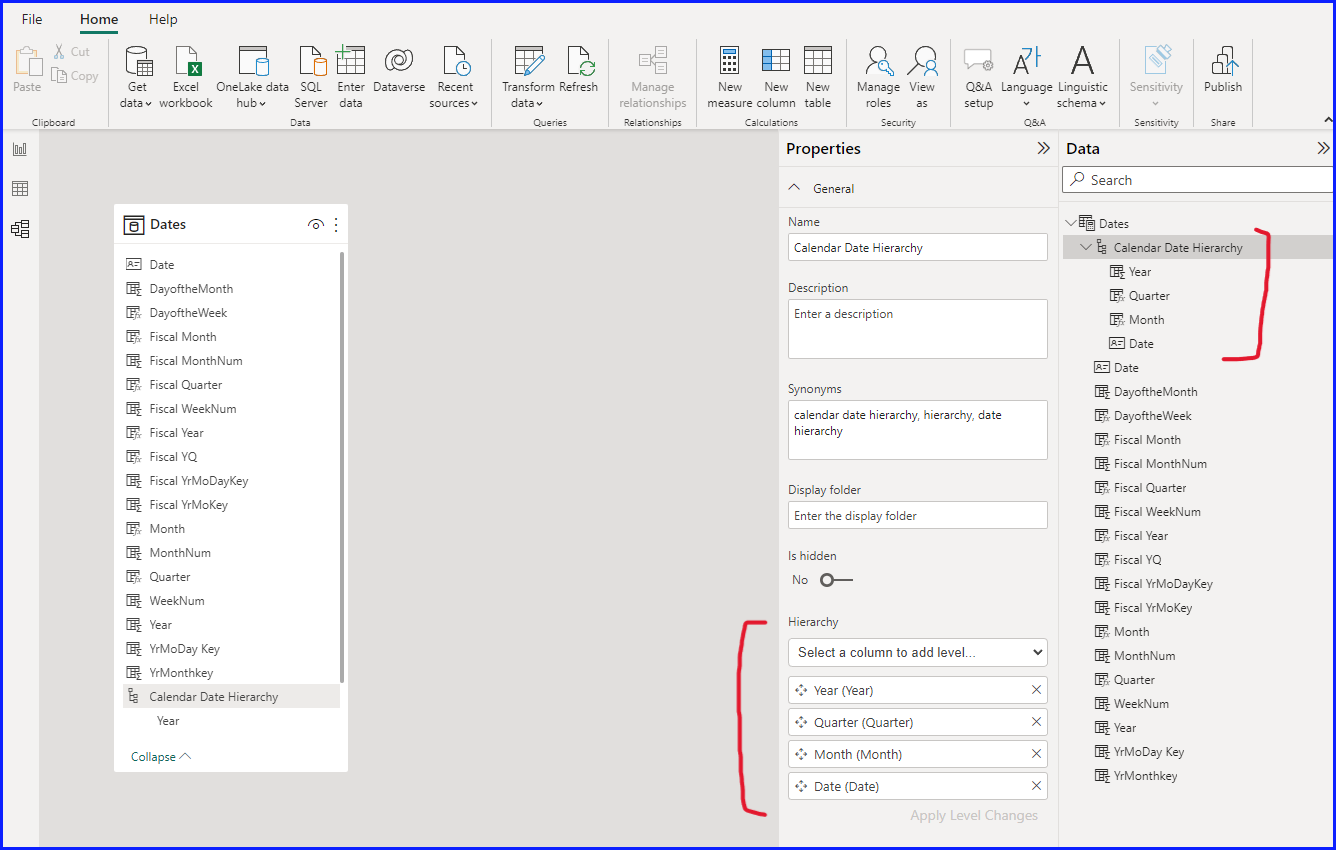
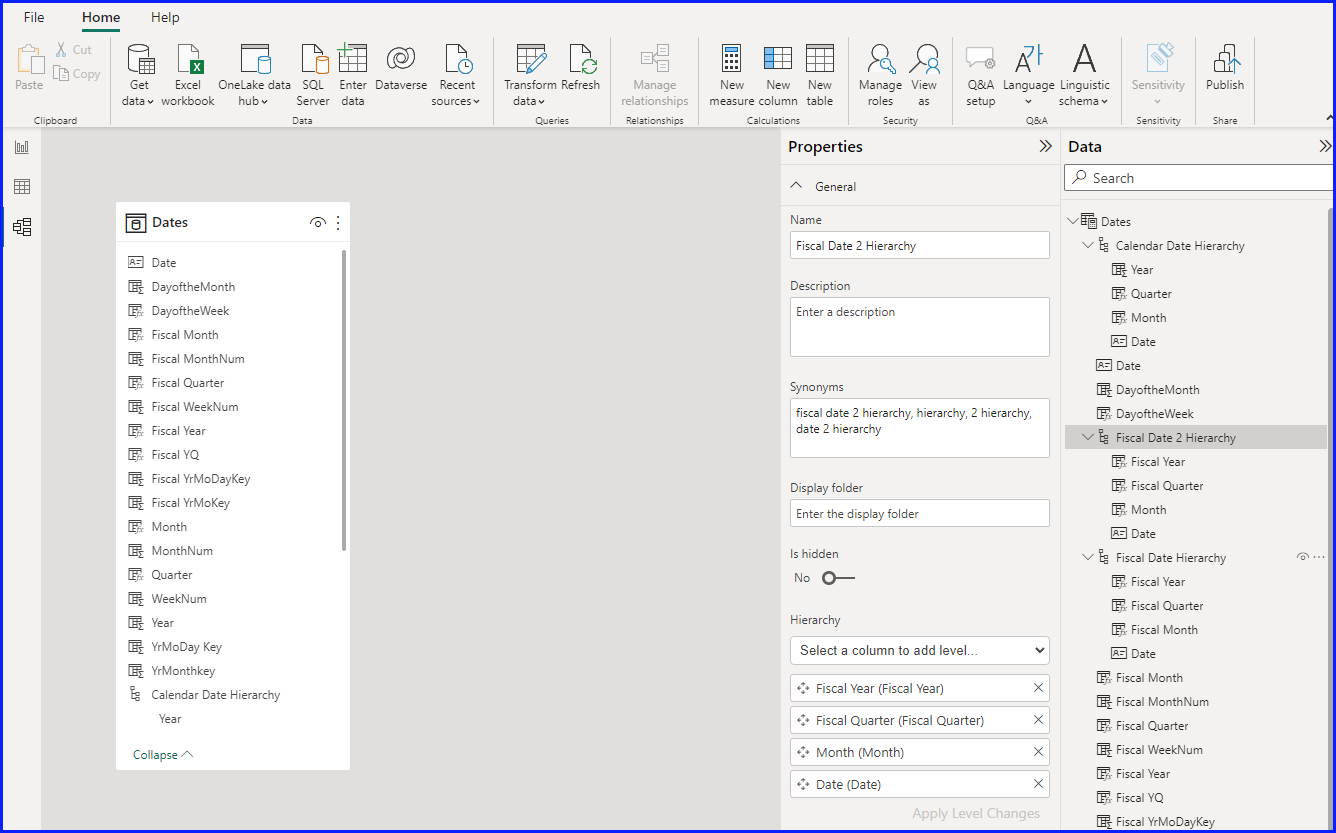
I create one for the Calendar Year and two for the Fiscal Year shown below. All are based on the Date field.
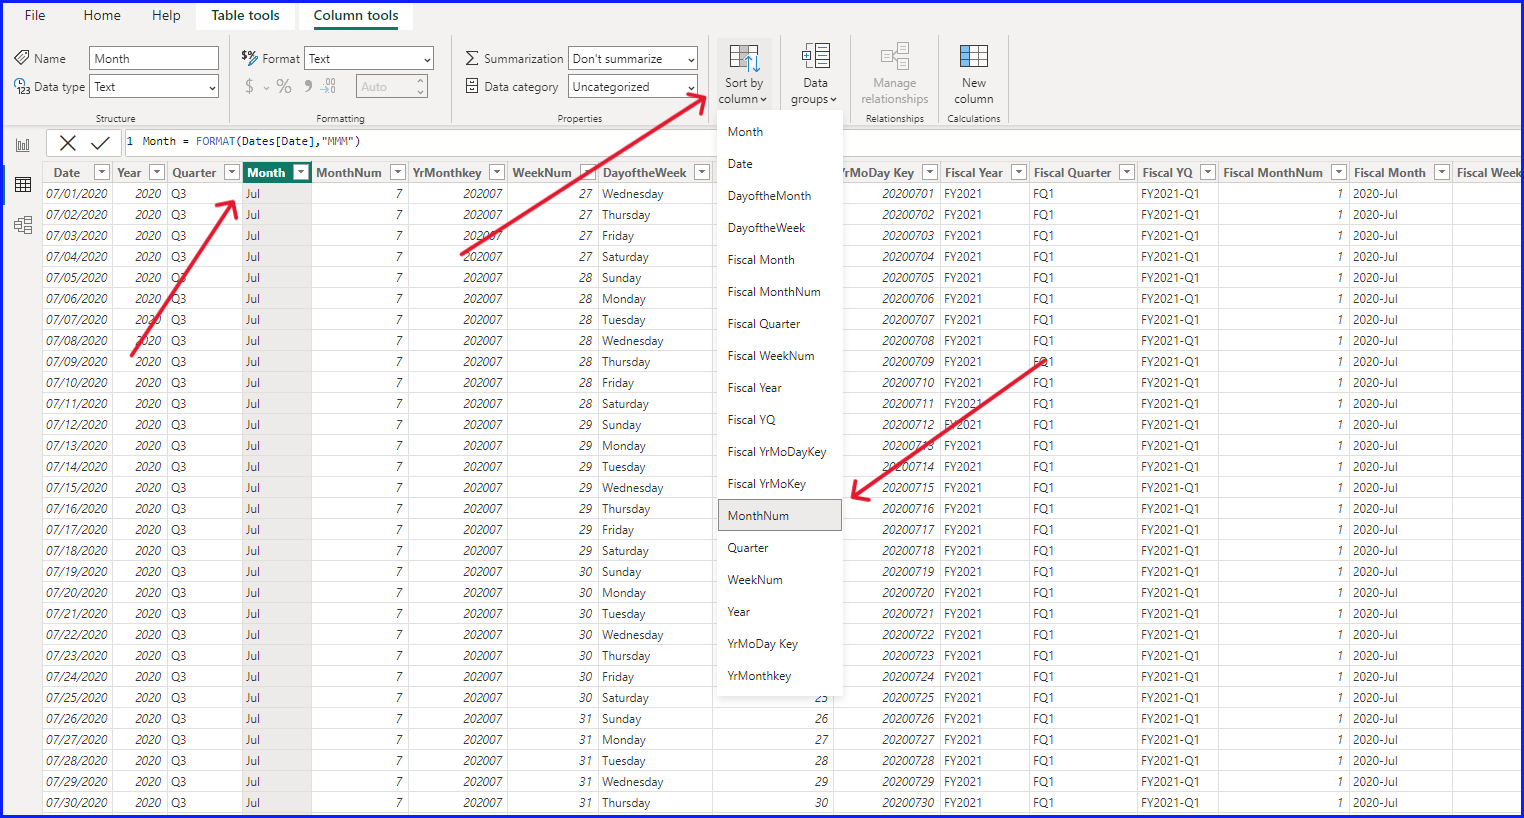
Setup Month Column Sort
Lastly, we need to adjust the sort properties for the Calendar Month and Fiscal Month columns so they will sort according to their proper date order. This is to prevent them from sorting alphabetically since they are text fields.
Click on the Month column, then Sort by Column, then MonthNum. For Fiscal Month, select Fiscal MonthNum.
Now your Date Table is ready to be put to work.
Results
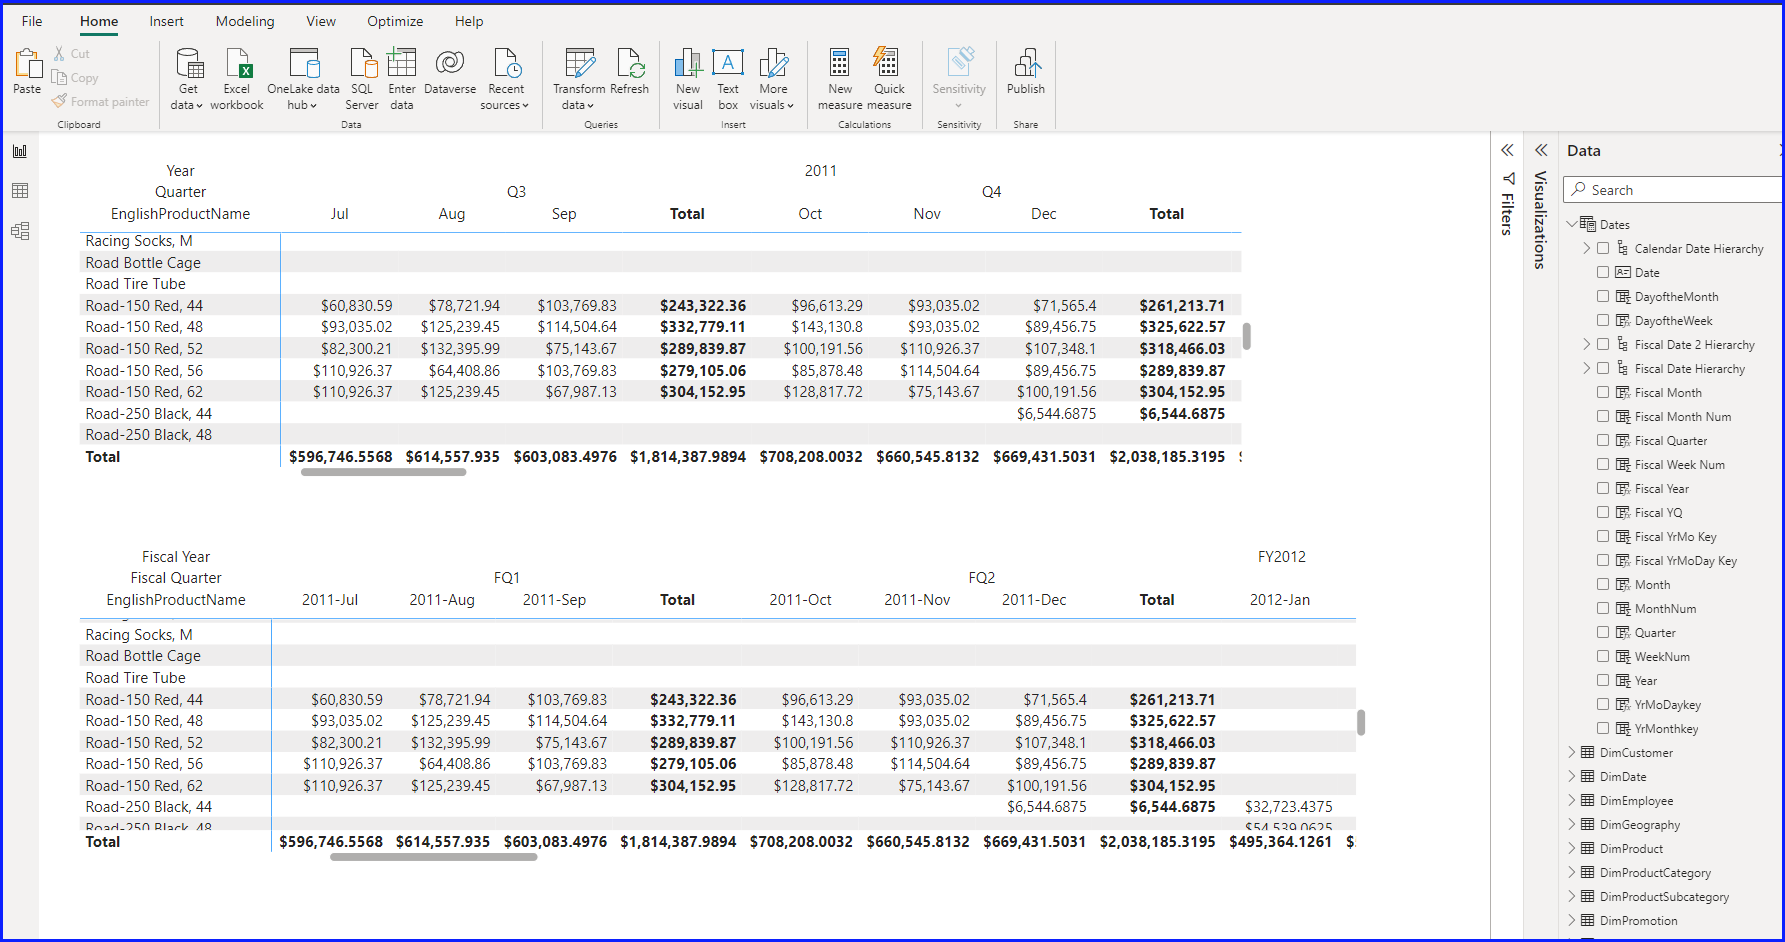
Below is an example of using the Date Table with the Adventure Works 2019 dataset. I replaced the existing DimDate table with my table as the main Date Table. You can see the comparison between the calendar year and fiscal year against the same dataset. Notice the month totals are the same but the Year and Quarters are different. The top table is the Calendar Year, and the bottom table is the Fiscal Year.
I use my table frequently at Microsoft when asked to prepare reports based on either Calendar Year or Fiscal Year or both and having this table provides the ability to do either in Power BI or Excel quickly and easily. I hope it can add the same value to you when building static or ad-hoc reports.